Objective: what is a storm hydrograph and how does it respond to change?
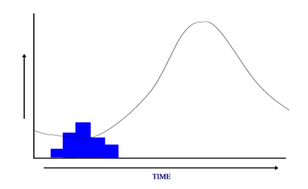
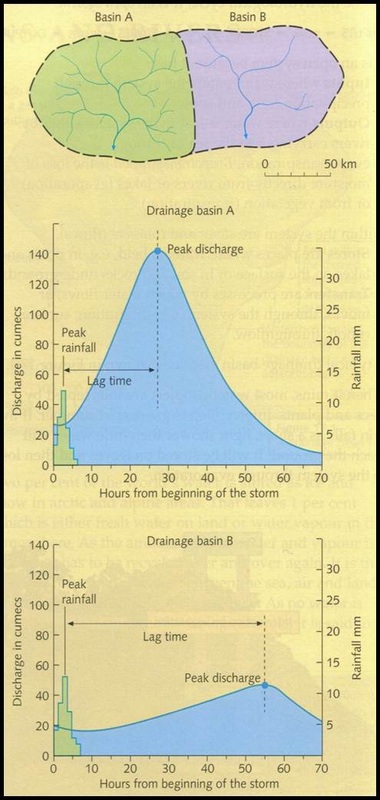
Task 1: What does this graph show? Write your ideas down....
yOUR TURN...
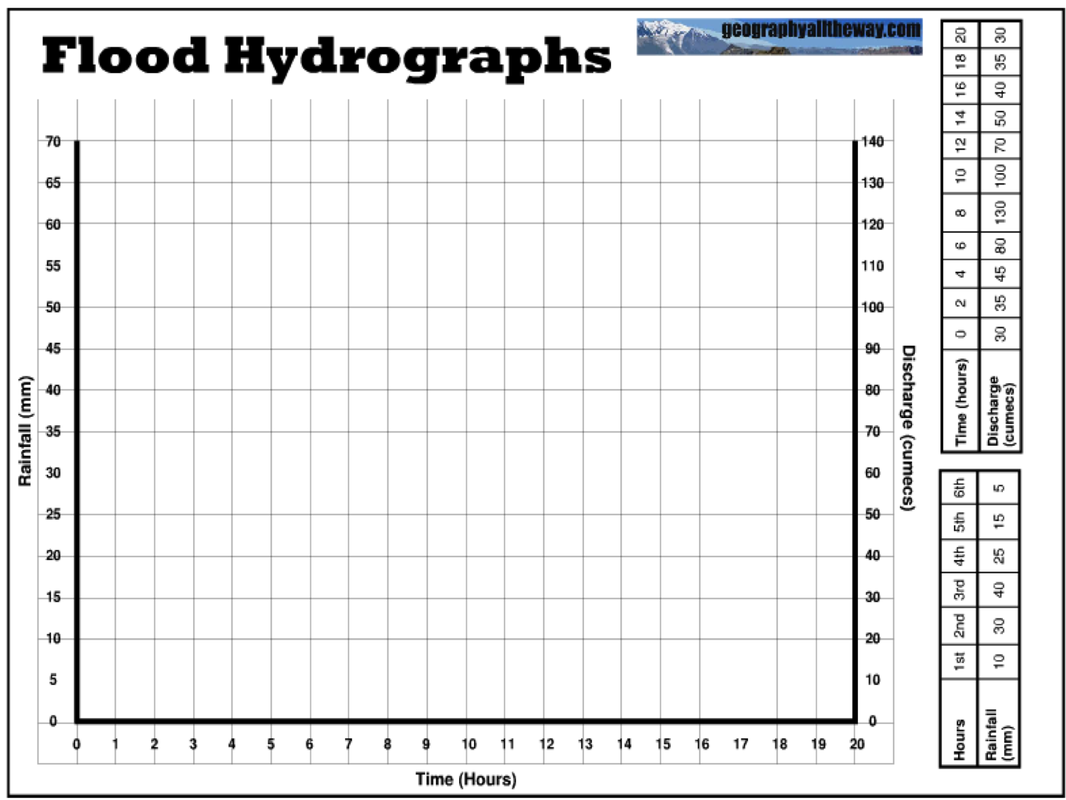
Task 2: Use the data to draw your own storm hydrograph.
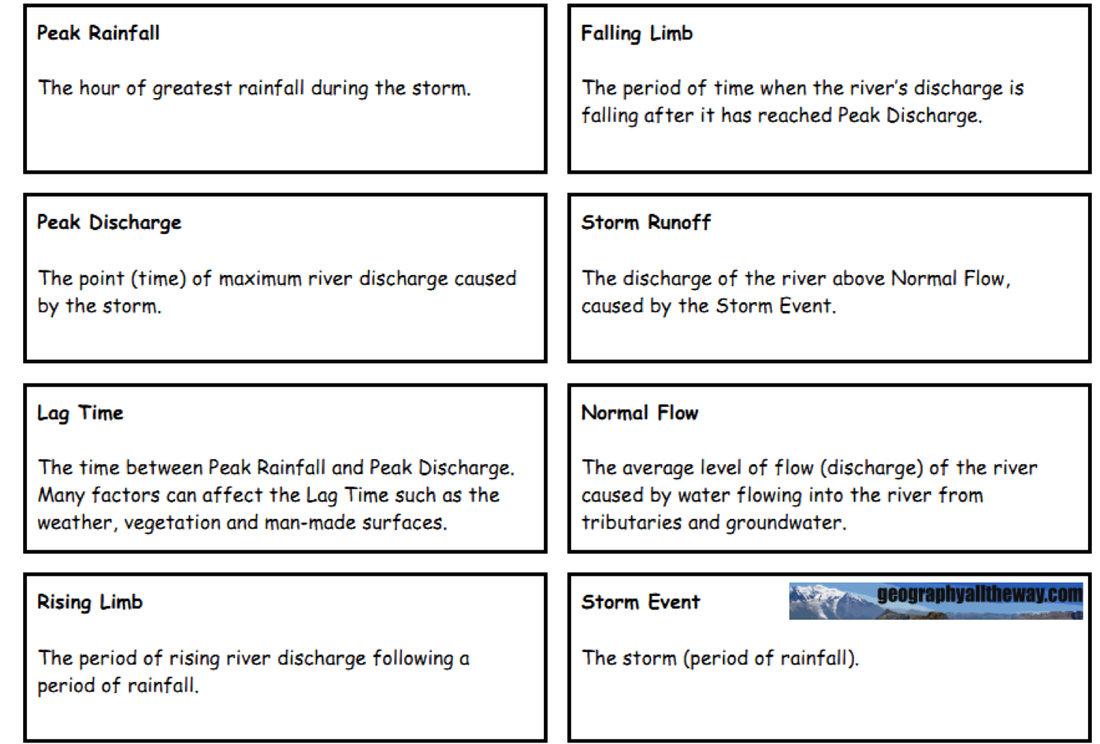
Task 3: Add the key words to you complete hydrograph. (Geography all the way resources)
|
Task 4: Complete the following activities reviewing what you know about hydrographs so far.
|
Task 6: What factors affect the shape of a hydrograph? Brainstorm your ideas.
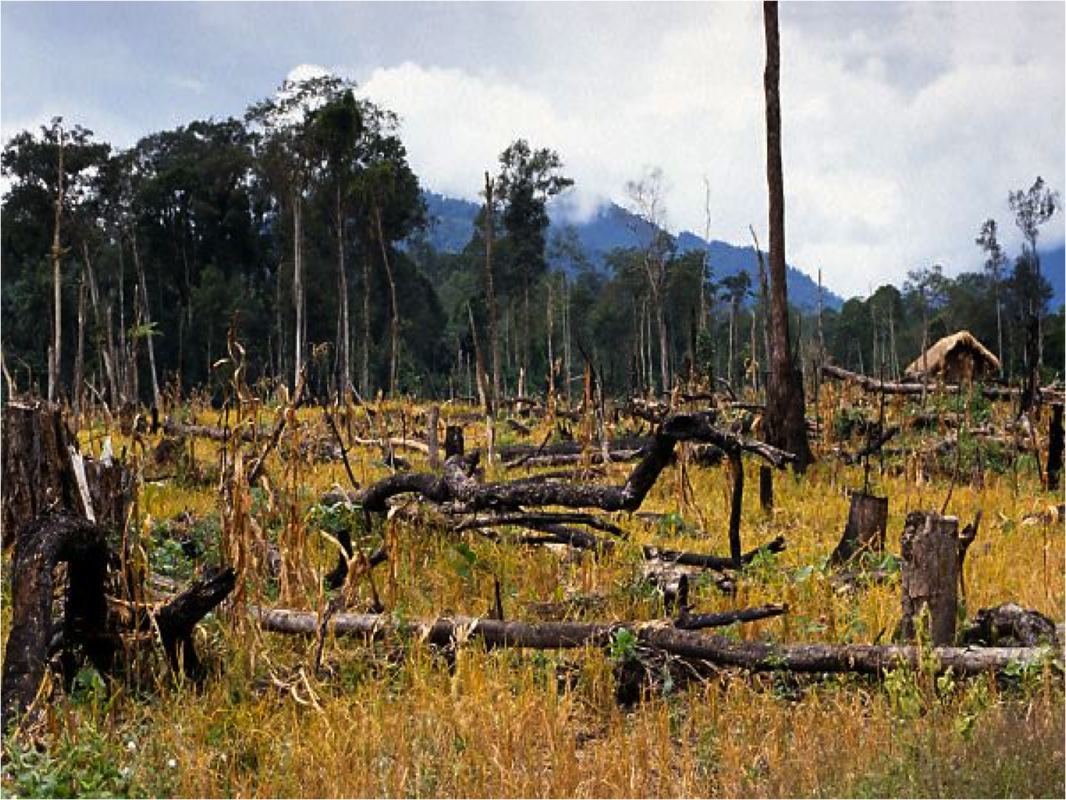
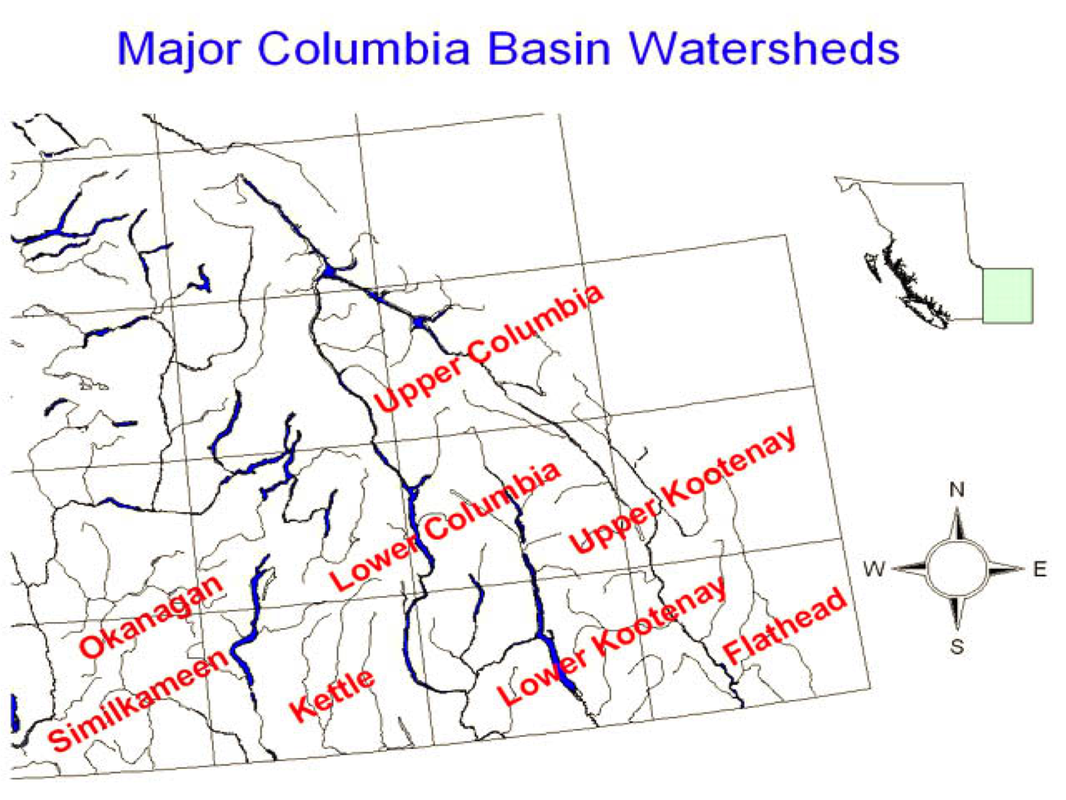
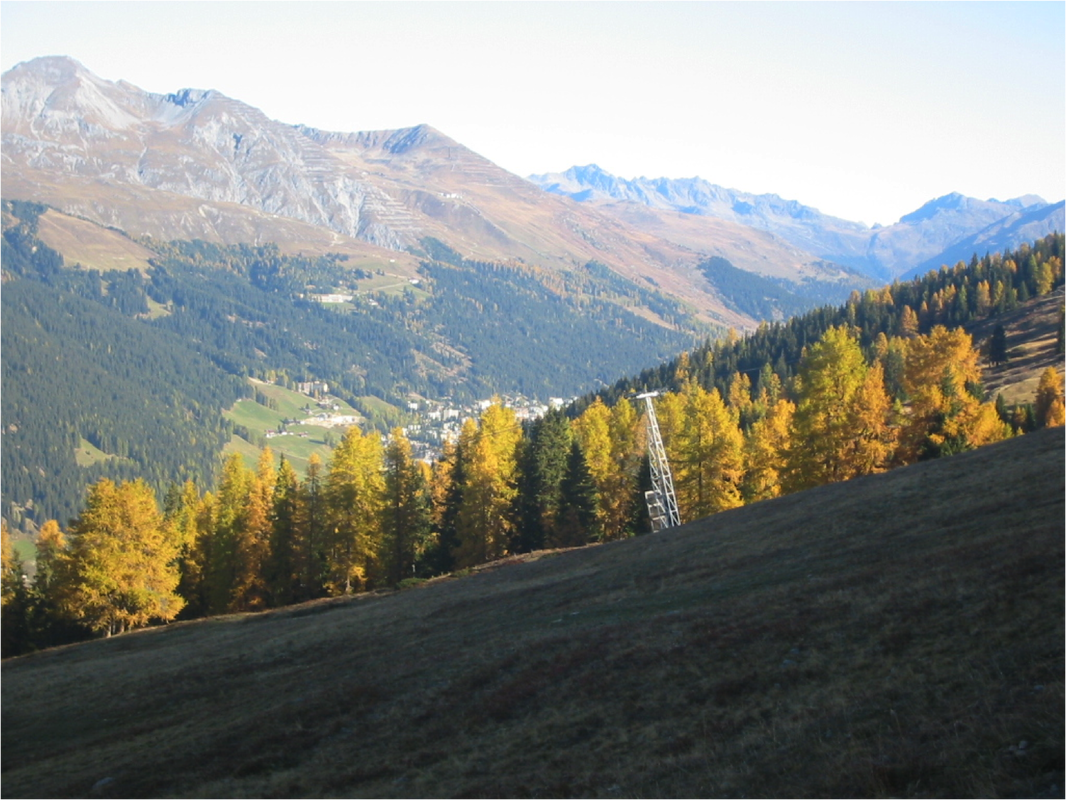
Task 5: Look at the photos below. Read the description and explain how each will affect the lag time. Be ready to feedback to the group.

|
Task 6: Compare the shapes of the 2 hydrographs. Use the table below to help structure your explanations. |
|
A dummies guide
In no more than 5 bullet points, describe what a hydrograph shows and why it is important.